Query languages
Huntbase lets you query in the language that fits the data you're after — a unified SQL dialect across every connected source, the native language of a single SIEM, a graph language for the entity graph, STIX patterns for indicator sweeps, or plain English that Scout translates for you. This page lists each language, how you pick one, and the parameter and time-range conventions that work everywhere.
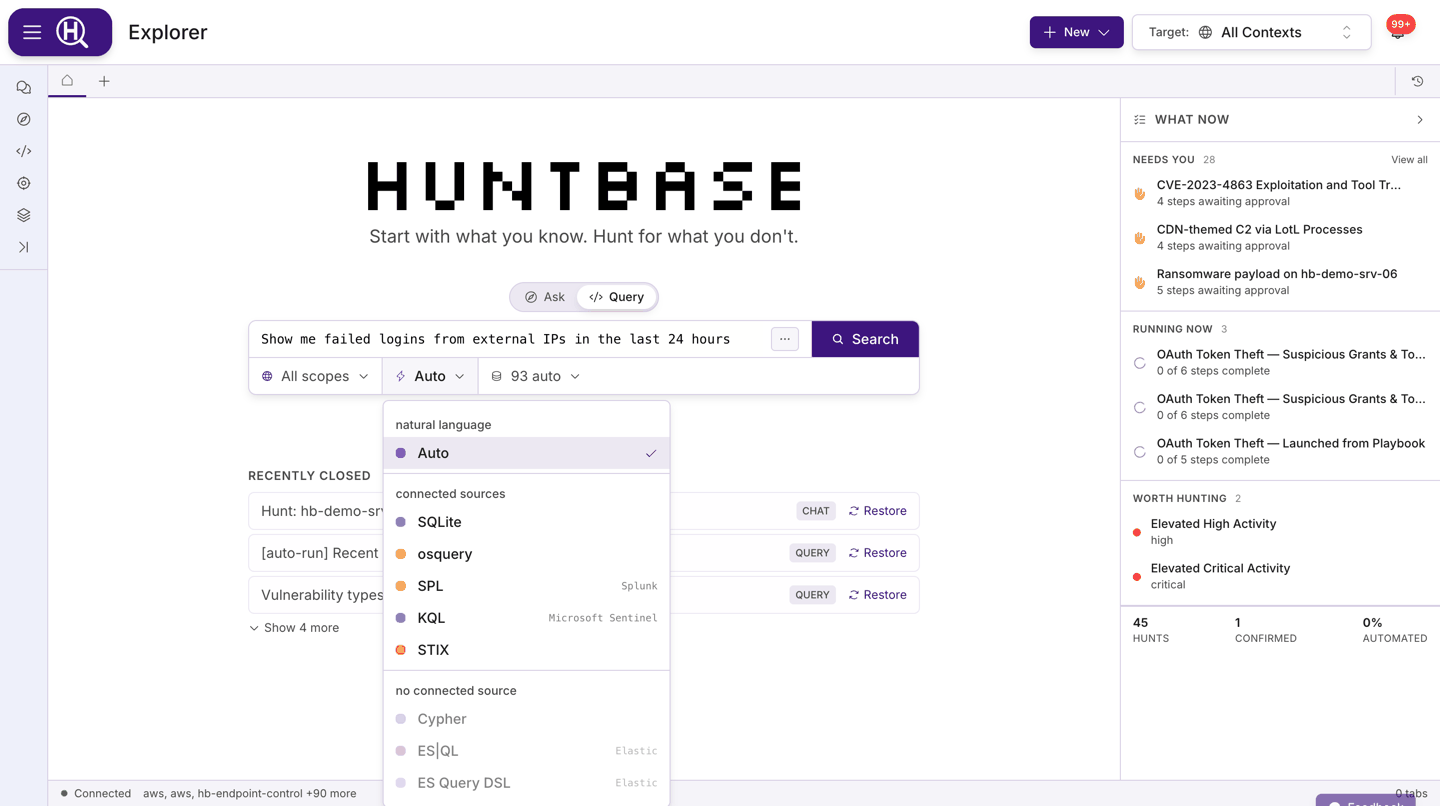
Choose a language
In a query tab, the first pill in the query bar selects the language. The menu is grouped by what your connections can serve:
| Group | Contents |
|---|---|
| natural language | Auto — describe what you're looking for and Scout translates it. |
| connected sources | Languages that at least one connection in your current scope can run. |
| no connected source | Languages nothing in scope serves yet. Dimmed but still selectable, so you can draft a query before the matching connection exists. |
Which group a language lands in depends on your connections. As a rule of thumb:
| Language | Typically served by |
|---|---|
| Auto | Any source — Scout picks the language and connections for you. |
| SQLite | Every connected product, through Huntbase's unified schema. |
| osquery | Endpoint Control (osctrl) fleets and other osquery-based products. |
| Cypher | The Huntbase entity graph — no connection needed. |
| KQL (Huntbase Lake) | The Huntbase data lake plus your own lakes in federation — no connection needed. |
| Search (Huntbase Lake) | The telemetry you ship to Huntbase, plus your own lakes when you ask — no connection needed. Offered in a new tab's Query shape (beta). |
| SPL | Splunk connections. |
| KQL | Microsoft Sentinel and Azure Data Explorer connections. |
| ES|QL, ES Query DSL | Elastic connections. |
| STIX | Any connection with a STIX translator (see below). |
When you open a query template from the Library, the language is locked to the template's language.
Auto (natural language)
Type what you want in plain English and Scout turns it into a query, chooses the connections, and decides the time window. Use it when you don't know which table or index holds the answer.
show me failed logins for admin accounts from outside the US in the last day
Scout's translated query is shown before it runs so you can review it, edit it, or switch to the underlying language.
If what you type on Auto is already a query — SQL, SPL, KQL and so on — it runs in that language: the language pill switches to it, and the run uses that language's connections. For SQL, the dialect follows the tables the query names (an Okta table is read with SQLite, for example) and then the connections in scope.
SQLite
Unified SQL across all connected data sources. Tables map to normalized datasets, so the same query runs against every product that supplies the data. Use the Schema option in the query bar's ⋯ menu to browse platforms, datasets and columns and insert names into the editor.
SELECT user_name, src_ip, COUNT(*) AS attempts
FROM authentication
WHERE status = 'Failure'
  AND time > datetime('now', '-{{days_back:number}} days')
GROUP BY user_name, src_ip
HAVING attempts > 10
ORDER BY attempts DESC;
osquery
SQLite over your endpoint fleet: each endpoint exposes its state as tables (processes, users, listening_ports, and so on). With osquery selected, a fleet pill in the query bar lets you target the whole fleet, filter by tag, OS or hostname, or pick exact endpoints. See Endpoint Control.
SELECT p.pid, p.name, p.path, p.cmdline, u.username
FROM processes p
JOIN users u ON p.uid = u.uid
WHERE p.path LIKE '/tmp/%'
   OR p.path LIKE '/dev/shm/%';
Cypher
Graph query language for the Huntbase entity graph — users, hosts, IPs, files, processes, and the relationships between them. Cypher runs against Entity graph rather than a connection.
MATCH (u:user)-[:AUTHENTICATED_TO]->(h:device)<-[:AUTHENTICATED_TO]-(other:user)
WHERE u.name = {{user}}
RETURN h.hostname, collect(other.name) AS also_logged_in
LIMIT 50
KQL (Huntbase Lake)
Kusto over the Huntbase data lake. Like Cypher it needs no connection — the query bar shows Data lake instead of a connection picker, because one query searches Huntbase's own store plus every lake of yours that is in federation at once. Your lakes are read in place and never written to. Reads of them are estimated first and count against your organization's daily scan budget, and a KQL (Huntbase Lake) query that Auto runs on Enter reads the Huntbase data lake only. See Data lake.
The pill says KQL (Huntbase Lake) to distinguish it from KQL, which is the Microsoft Sentinel passthrough further down this page. The syntax is the same Kusto you already know; the target is different.
Search telemetry writes this language for you. Search your shipped events and filter them by clicking, then use Show as query to get the KQL (Huntbase Lake) query that returns exactly those events. It's a good way to learn the dialect against your own data.
telemetry
| where command_line has "-enc"
| where store == "northwind-eu"
| take 100
Results carry a store column naming which store each row came from, and the results panel reports how many stores were searched — and warns you if any were skipped, because that makes your answer incomplete. The time-range pill applies.
What the dialect supports
Lake KQL is a documented subset of Kusto: filtering, projection, aggregation
and take over a single table.
| Not supported | Instead |
|---|---|
join | Query each table separately. |
let | Inline the expression. |
mv-expand | — |
One difference to watch: has matches a substring here, not a whole token.
An unsupported query fails fast with a clear error rather than being quietly reinterpreted, so pasting a complex Sentinel query and getting a refusal is the expected outcome — not a bug.
Search (Huntbase Lake)
This feature is currently rolling out and may not be enabled for your organization.
A search of the raw events your shippers send to Huntbase through telemetry
ingest keys. It reads the Huntbase data lake, needs no connection, and
supports a time range: the window you pick in the time-range pill bounds the
search, and running it again measures the window afresh. In a
new tab, it's the first entry in
Query's language pill, and /search picks it. Press Enter to run it.
An empty search returns every event in the window.
Enter searches the Huntbase data lake only. If you have lakes of your own in federation, press ⌘/Ctrl+Enter to search them too, or include them in the stores pill. Reading your lake counts against your organization's daily scan budget. See Data lake.
powershell -svchost host:WKST-4471 -user:svc_backup parent_process:*
| Syntax | Meaning |
|---|---|
word "quoted phrase" | The event contains it. Every word and phrase must match. |
-word | The event doesn't contain it. |
field:value, field:"a value" | The field has that value. |
-field:value | The field doesn't have that value. |
field:* / -field:* | The field is present / absent. |
host:a host:b | A repeated field matches either value. |
a OR "b c" OR 1.2.3.4 | The event contains any of these words or phrases. OR must be in capitals; a lower-case or, or a quoted "OR", is plain text. OR joins words and phrases only: to match either of two values of a field, repeat the field. |
@host: @source: @event_type: | The same as host:, source: and event_type:. |
A value that starts with / or : is plain text, so IPv6 addresses, URLs and
times search as written. Huntbase compiles the search to
KQL (Huntbase Lake); switch a search tab to Query to
see that query. A search is saved as a query, so it has a run list and can be
added to a hunt or scheduled. See Search telemetry.
SPL
Splunk Processing Language, passed straight through to a Splunk connection. Huntbase adds the time-range pill's window as the search's earliest/latest bounds.
index=main sourcetype=WinEventLog:Security EventCode=4625
| stats count BY Account_Name, src_ip
| where count > 10
| sort - count
KQL
Kusto Query Language for Microsoft Sentinel and Azure Data Explorer connections, passed through natively. The time-range pill bounds the query.
SigninLogs
| where ResultType != 0
| summarize attempts = count() by UserPrincipalName, IPAddress
| where attempts > 10
| order by attempts desc
ES|QL
Elasticsearch's piped query language, passed through to an Elastic connection. The time-range pill bounds the query.
FROM logs-*
| WHERE event.category == "authentication" AND event.outcome == "failure"
| STATS attempts = COUNT(*) BY user.name, source.ip
| WHERE attempts > 10
| SORT attempts DESC
| LIMIT 100
ES Query DSL
Elasticsearch Query DSL in Lucene query-string form, passed through to an Elastic connection. The time-range pill is applied as a range filter.
event.category:authentication AND event.outcome:failure AND NOT source.geo.country_iso_code:US
STIX
STIX 2.1 pattern expressions for indicator-based sweeps. A STIX pattern is written once and translated per connection into that connection's native language, so a single run can check the same indicator across every source that supports it.
[ipv4-addr:value = '203.0.113.50'] OR [domain-name:value = 'malicious.example.com']
Match a file by hash:
[file:hashes.'SHA-256' = 'e3b0c44298fc1c149afbf4c8996fb92427ae41e4649b934ca495991b7852b855']
STIX patterns carry their own time qualifiers (START / STOP), and each connection's translator applies its own default lookback. The time-range pill is hidden for STIX so the two don't conflict.
Parameters
Any language can contain parameters. Write {{name}} in the query and Huntbase renders a field for it in the parameter strip under the query bar; the value is substituted when you run. Templates saved to the Library keep their parameters, so anyone running them fills in the same fields.
Syntax
{{name}}                 string (default)
{{name:type}}            typed parameter
{{name:enum[a,b,c]}}     pick from a fixed set
- Names may contain letters, digits, underscores and hyphens, and must start with a letter or underscore.
- The first occurrence of a name sets its type; reuse the same
{{name}}anywhere in the query. - Every detected parameter is required. When you save a template, the Parameters editor lets you set a description and a Default value for each one.
Types
| Type | Field shown | Notes |
|---|---|---|
string | Text | Default when no type is given. |
number | Number | |
boolean | Toggle / select | |
datetime | Text (date and time) | |
date | Text (date) | |
list | Text | Comma-separated values, sent as a list. |
enum[…] | Select | Options come from the brackets, e.g. {{sev:enum[low,medium,high]}}. |
json | Text | Raw JSON passed through. |
secret | Text | Treated as sensitive. |
Time range
For SPL, KQL, ES|QL, ES Query DSL, KQL (Huntbase Lake) and Search (Huntbase Lake) the query bar shows a time-range pill (for example Last 1 hour). The window you pick is sent with the run and applied by the connection natively — you don't need to repeat it in the query. SQLite, osquery and Cypher express time in the query body, Auto lets Scout decide, and STIX uses its own qualifiers, so the pill is hidden for those.
Tips
- Start in Auto when you're unsure where the data lives; switch to the translated language to refine.
- Use the Schema tree to confirm dataset and column names before writing SQLite — it also filters to what the selected language can query.
- Keep native queries (SPL, KQL, ES|QL) bounded with the time-range pill rather than a hard-coded window; templates then stay reusable.
- Prefer parameters over literals for anything you'll change between runs (usernames, hosts, lookback), then Save as template.
- Field names in SQLite follow the OCSF-based normalized schema — see OCSF.
Next steps
- Query workspace — the query bar, editor, results and export
- Query templates — save parameterized queries to the Library
- OCSF — the normalized schema behind SQLite queries
- All integrations — which languages each product serves
- Connections — add the sources that unlock each language